
By Sam Remie, Bart van Duijvenbode and Emma Zijp
I. Introduction
This data story will analyse in which ways ethnicity played a role in the ownership of enslaved people in the urban environment of Paramaribo in the period 1837-1846, and additionally, how this expressed itself spatially and temporally within the confines of the city. The focus on Paramaribo was chosen as enslaved people within an urban setting have often been ignored in the historiography, with the Atlantic slavery on the plantation being the central topic of research. On top of that, it gives the opportunity to analyse an overlooked group of slave owners: non-white enslavers (4, pp. 12). This group is interesting because it enables us to discern the particularities of ethnicity by comparing the black and mixed communities. To look at the role of ethnicity in the practice of slave ownership, this data story will be using the Ward Register, which provides information on individual citizens as well as enslaved people living in the different districts of the Surinamese capital between 1828 and 1847 (2).
Suriname was colonised by the Dutch Republic in 1667, and soon after, Paramaribo, its capital, became the administrative and commercial centre of the colony (6, pp. 100). Paramaribo was the only urban area of the colony and grew strongly in the late 18th and early 19th century, from 1.881 citizens in 1762 to 15.510 in 1862 (5, pp. 43). This population growth resulted in the division of the city in different districts, for the first time in 1828, with the arrival of districts (wijken) A, B, C and D, and again in 1837, with districts E and F and the two outer districts (buitenwijken). Alongside the general growth of the city of Paramaribo, one group in particular expanded rapidly: free non-white citizens. From the beginning of the 19th century, they had become the biggest population in the Surinamese capital (5, pp. 26). With the spread of the city, the local colonial government needed new forms of registration – besides civil registration – to be able to fully govern these different districts, and consequently, the Ward Register was set up. For each plot in the city, the names, ages, occupation, and religious affiliation were written down for the heads of the households. From 1837 on, the register also included the number of enslaved people living on an address and some of their characteristics as well: sex, racial category (either black or mixed), and their age, which was registered as either adult or child with the age of 14 as the cut-off point. This registration is a rich source of history and enables us to study the role of ethnicity within the confines of Paramaribo (6, pp. 101-102).
The city plan of the Surinamese capital was characterised by both racial concentration and racial micro-segregation in the researched period (3, pp. 243-244). On the one hand, this meant that the ethnically mixed population lived all over the city, but some areas were mainly populated by one of the three main groups –white, mixed and black– which will be discussed in this data story. In general, the white community had mostly settled near Fort Zeelandia, i.e. district A and the first outer district. The free non-white community primarily lived in the southwest districts, E and F. These two districts were often referred to as Frimangron (“free man’s ground”), as it was a piece of land that had historically been inhabited by formerly enslaved people (6, pp. 101-102). On the other hand, plots of land were often inhabited by both slave owners and enslaved people. Enslavers lived in their houses at the streetside of the plot, while the enslaved people lived on the back of the plot in shacks (4, pp. 84). So while there was no general racial segregation, there were certain patterns in racial distribution across the city.
Slavery in Paramaribo took many forms. The enslaved were used for domestic labour, but were also often rented out for various tasks, such as carpentry, dock work or selling goods. Some enslaved would be free in their decision of labour, but would have to pay their enslaver a fixed rate (4, pp. 86). While this could create income for the enslaved, it didn’t guarantee freedom in the long-term, as the Dutch colonial system didn’t allow for enslaved people to purchase their own freedom. Instead, manumission would happen through a proposal of a free person to the Council of Policy (Raad van Politie) or by testimony of the enslaver. There was also an unregistered form of manumission, named piki-nyan, where enslavers had given the enslaved their freedom, while remaining registered as enslaved (4, pp. 128). Even if formally manumitted, the formerly enslaved would still remain tied to their former enslaver through their last name and the obligation to help them in the event of economic hardship (4, pp. 48-49). The slavery-freedom binary should thus be approached with caution.
II. Methods & Data Description
For this data story Druid and R Studio will be used to look at the temporal and spatial distribution of ethnicity within the city of Paramaribo. To do so, our queries were focused on the variables: year, district, ethnicity and counts for enslavers and enslaved persons.
It is important to make a few remarks about the data itself beforehand. Firstly, ethnicity was recorded in the Ward Register as white, mixed, black or indigenous. However, only the first three categories will be used in this data story. There are very few observations of a slave owner being recorded as indigenous, making this group negligible. Another important point is that our data findings adhere to the ethnic categories of the digitalised Ward Register which uses skin colour as a proxy for ethnicity or race. However, as Thunnis van Oort aptly noted it is important to remember that race was not a stable category in the source, and therefore, should be approached critically (6, pp. 102). Karwan Fatah-Black furthermore argues race was often ambiguous and had a certain fluidity (4, pp. 62). Additionally, none of the groups should be viewed as homogenous. The black population had various African origins and the white population consisted mostly of people with Dutch, German and Portuguese-Jewish descent (7, pp. 32). We will be looking at the years 1837 up to and including 1846 due to the aforementioned fact that ethnicity was recorded only from 1837 on. Next to that, some years are absent or very poorly recorded so these, 1839, 1840, 1843, 1844 and 1847, will be left out of our analysis. Besides that, the data that we have for the period 1837-1846 is not always available for all districts. Ethnicity data is most consistently available for the districts B, D, E and F.
After analysing the data from the Ward Register through Druid and R Studio, it will be presented in two maps which show the breakdown of the ethnicity of slaveowners in Paramaribo in 1838 and 1846. The visualisation is done through GIMP, an open-source image manipulation tool. The map that is used as the base is the ‘Plan van de stad Paramaribo, met aanwijzing der Nieuwe Wijk verdeeling’ which was produced by A.G. Hiemcke and J.P.E. Petit in 1850 (1). It should be noted that maps are not a neutral representation of reality. The map shows Paramaribo in a colonial orderly fashion, while several parts of the city were neglected and regular floods would sometimes flush away land (4, pp. 85). The first map shows 1838 instead of 1837, since data of district A – important for its prevalence of white enslavers compared to the more balanced district C that is missing in 1838 – is unavailable in 1837.
III. Data Selection
The Paramaribo Ward Registers are available as linked data. The linked data model is designed around person observations in the registers, which are encoded using the PiCo (persons in context) model as a basis. This model encodes information to contextualize person observations in a source.
For this data story, we want to extract the data on enslavers and enslaved person observations. Through the data model, we can distinguish two categories of person observations we want to select: persons who enslave other persons, and persons who are enslaved by others.
We selected data using four main queries:
-
EnslaverWijkYearEthnicityCount, which counts the distinct
number of enslavers with a particular ethnicity registered in a district
within a given year (between 1837 and 1846). We select the variables
year,wijkandethn, and the count of enslavers of an ethnicity in a district in a year is saved ascount.
Resulting data from query EnslaverWijkYearEthnicityCount
-
EnslavedWijkYearCountwhich counts the distinct number of enslaved persons in a district within a given year (between 1837 and 1846). We select for the variables
yearandwijkand the count of enslaved persons in a district in a year is saved ascount.
Resulting data from query EnslavedWijkYearCount
-
count_enslaved_per_distinct_enslaver, which counts the number of enslaved persons registered with a distinct enslaver. We select for the variables
person,year,wijk,ethn,nameandenslaved_count.enslaved_countis the count of the enslaved persons enslaved by this person in a given year.
Resulting data from query count_enslaved_per_distinct_enslaver
-
PersonCountYearWijk, which counts the persons of a certain ethnicity registered in a certain year. We used this query to get total population statistics. Here we selected for the variables
year,ethnandcount.
Resulting data from query PersonCountYear
In the selected data, the counts are generally split up into the different selected variables. When we needed combined totals, we transformed the data outside Druid in either R, Excel or manually with a calculator. The combined totals and other measures (also calculated using R) used for analysis are included in the tables presented in this data story. We combined the data resulting from these queries to collect an overview of the extent of slavery within different ethnicities living in different areas of Paramaribo between the years 1837 and 1846.
IV. The Distribution of Enslavers in Paramaribo
As mentioned before, Paramaribo was a very ethnically diverse city and the same can be said for the slave owners living there. The total population of the Surinamese capital in 1838 was made up of 6.507 free citizens. The large majority, 72,6%, was part of the free non-white community of the city. The white community consisted of 1.783 people, while the mixed community had 3.729 people and the free black community consisted of 995 people. If we compare this to 1846, it shows that the expansion of the city persisted. The white community had grown to 1.964 people, while the mixed community consisted of 4.602 people. The black community increased slightly to 1.065 people in 1846. The same can be said for the prevalence of the non-white community which had increased to 74,26% (2). But was this relative majority in the population also visible when looking at the amount of non-white slave owners?
In the period 1838-1846, on average 439,5 free ethnically mixed slave owners were registered in the whole city and they were mostly concentrated in district E. This average was a lot lower when it comes to the black community as there were only 133,83 slave owners per year in this group. This group was also mostly present in district E. The white community is overrepresented in slave ownership. On average, there are 254,33 white slave owners per year in Paramaribo. The majority of these slave owners resided in district A, so it can be concluded that there is a spatial divide – between northeast and southwest Paramaribo – in the residence of slave owners according to their ethnicity (as shown in figure 1 and 2). This conclusion reconfirms the settlement pattern as it was described by Van Oort in which white colonists settled close to Fort Zeelandia, while the formerly enslaved mostly settled in Frimangron.
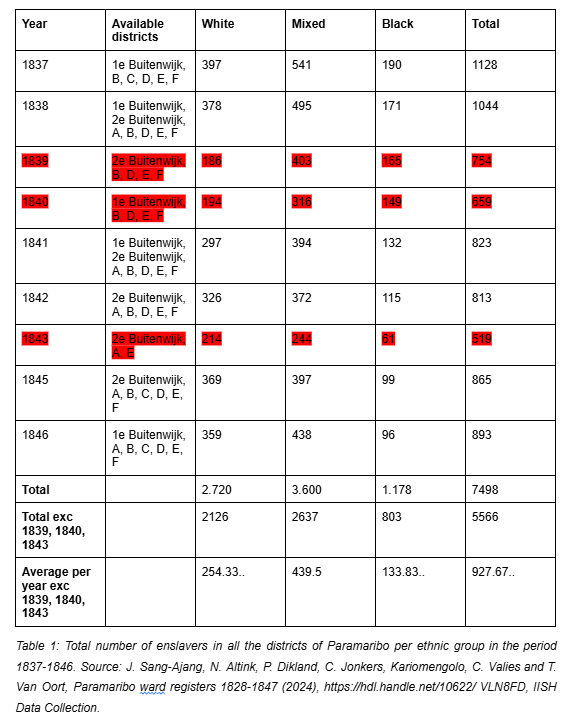
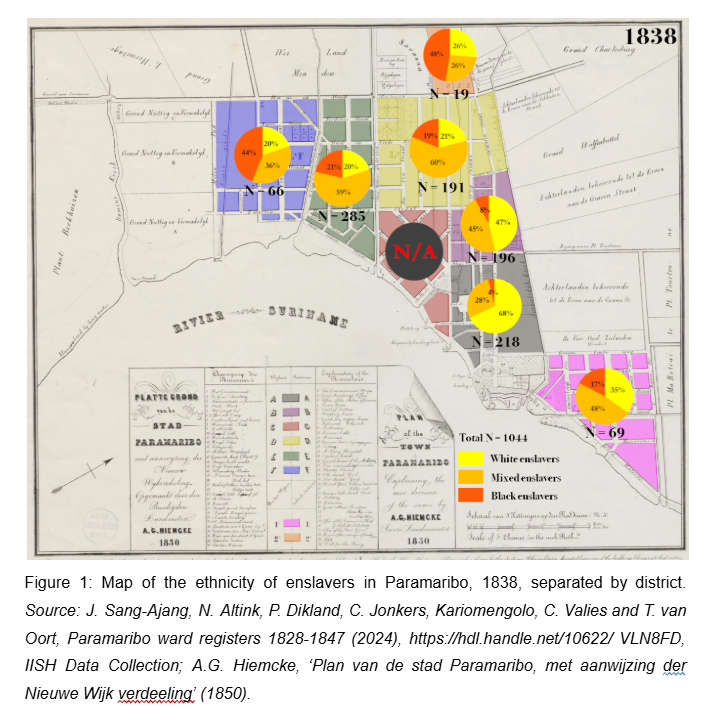
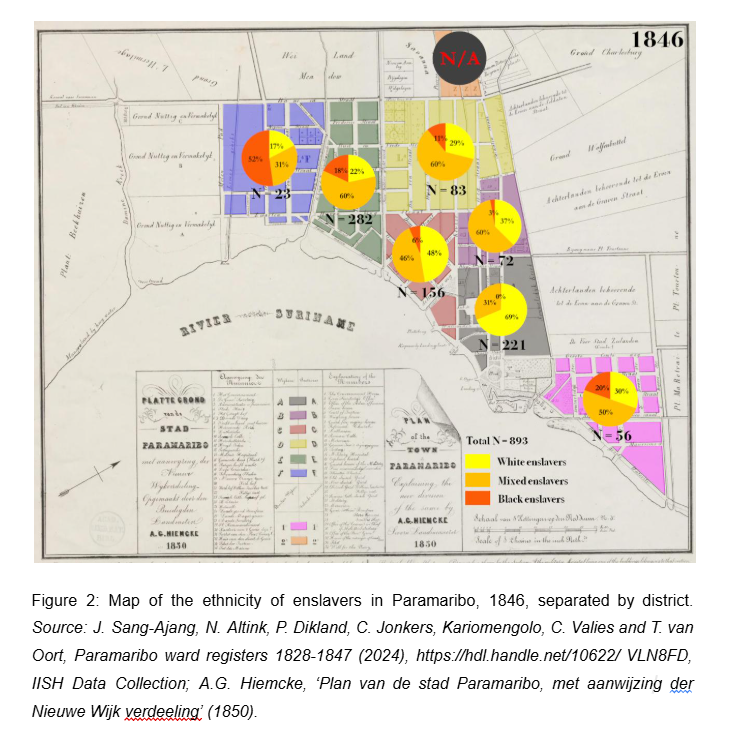
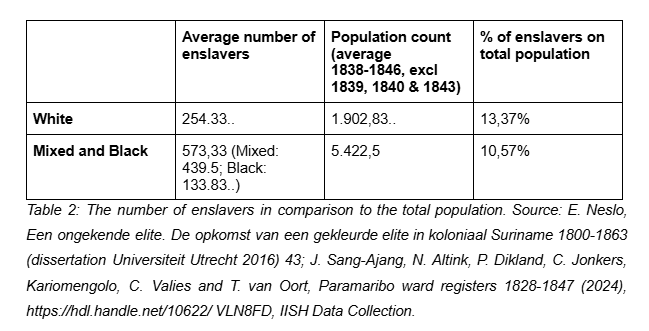
If the average number of non-white – both mixed and black – slave owners (573,33) is compared to the total non-white population (5.422,5), 10,57% is represented. But when the number of white slave owners (254,33) is compared to the total white population (1.902,83), they make up 13,37%. So it can be concluded that there is only a small difference - less than 3% - between the non-white and white communities when it comes to owning enslaved people. This is remarkable, since the white population generally had more means to purchase enslaved people (2; 4, pp. 167).
However, it is important to think about the motivation that the non-white communities had for owning enslaved people. While the practice was certainly important to gain prestige in a colonial and racialised society, it is important to note that the freed non-white communities also often used it to free others from enslavement. Within the phenomenon of chain manumission (kettingmanumissie), free non-white people liberated people they had close relationships with – such as family members – through purchasing them (5, pp. 50). Several people registered as enslaved could also be de facto free, through the earlier mentioned piki-nyan form (4, pp. 128).
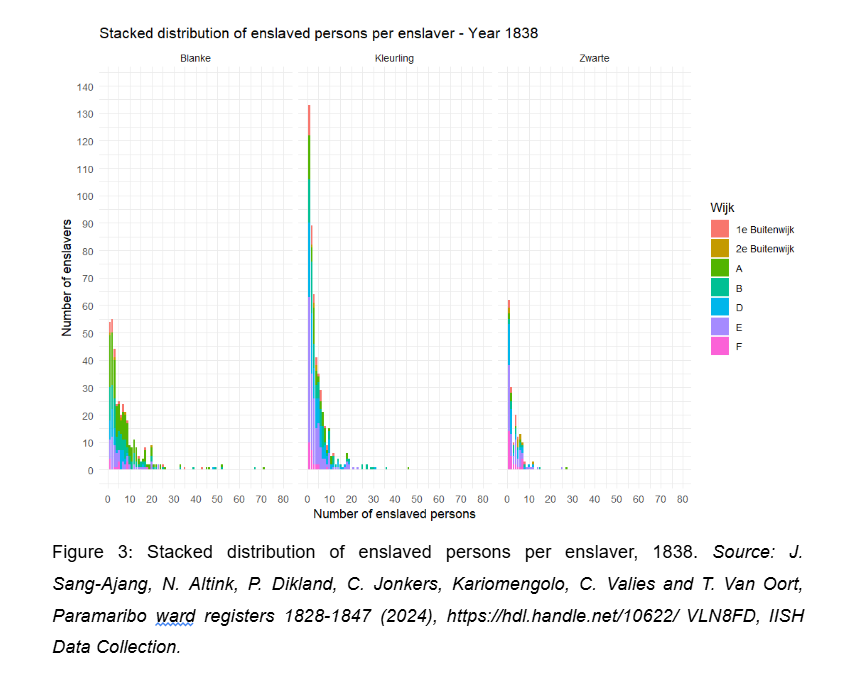
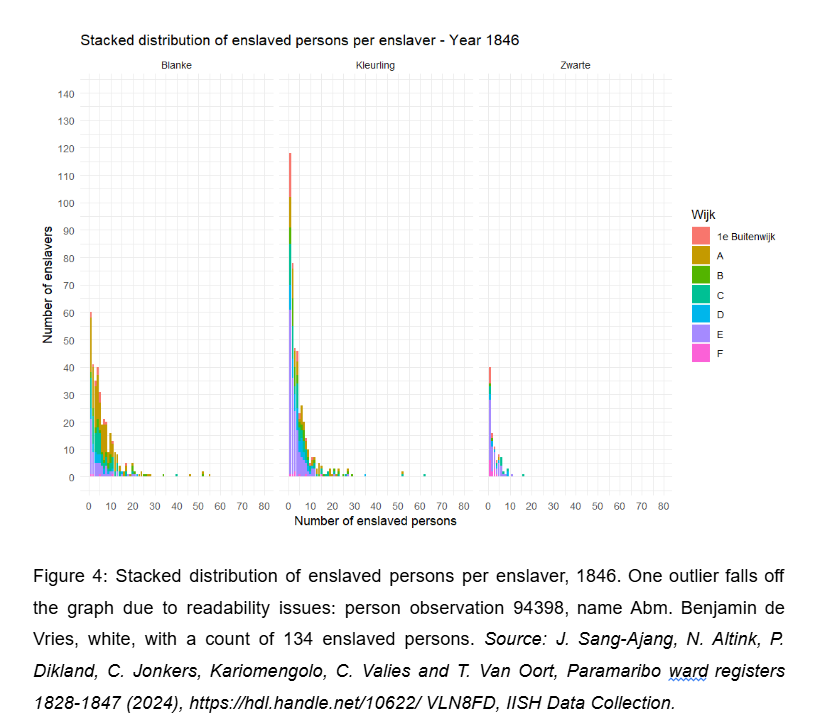
When looking at the stacked distribution of enslaved persons per enslaver, we can see different patterns of enslavement. Black and mixed enslavers often had 1-5 enslaved people, while the white enslavers have a much flatter distribution with much more outliers (enslavers having 20+ enslaved people). This seems to confirm our hypothesis that there were differences in slaving practices between ethnic groups.
V. The Spatial Distribution of Enslaved People
Even though the Ward Register provides information on the enslaved people in Paramaribo, it is incredibly limited. They are only included as a statistic not as an individual; so it is not possible to say much about this large part, i.e. 6.784 people in 1837 and 5.161 in 1846, of the Paramaribo’s society (2). For this data story, we will focus on their spatial distribution throughout the city to get a better understanding of who their enslavers were.
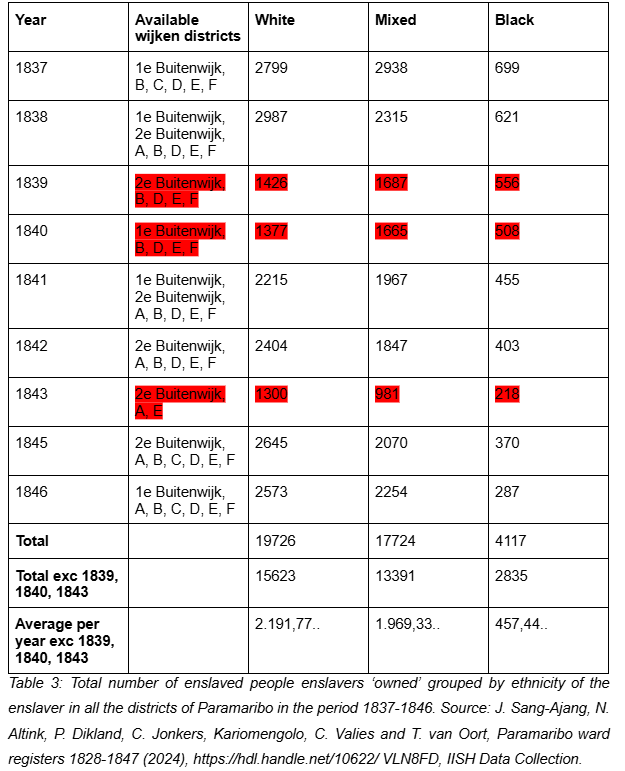
The spatial distribution of the enslaved population of Paramaribo largely follows the pattern of the enslavers. There is a clear concentration of enslaved people in districts A and E and the white and free mixed community dominate the numbers. The pattern is reinforced by the fact that the white community owned more enslaved people on average, about 2.191,77 enslaved people in the period 1837-1846. As described in the previous section, the white community was a minority in Paramaribo but relatively there were more white slave owners. The mixed community owned on average 1.969,33 enslaved people per year in the same period, while the black enslavers owned 457,44 people. It once again stands out that there are big differences between the non-white groups.
This perspective is confirmed by Ellen Neslo who describes that the mixed community had a privileged position in comparison to the free black community. The mixed community had these privileges partially due to the relationship with their father, who was a white man within the context of the Surinamese marriage. According to Neslo, the phenomenon of the ‘Surinamese marriage’ refers to the practice of white men marrying non-white women, due to the fact that there was a shortage of European women in the colony. Furthermore, it was not accepted for white women to have relations with non-white men (5, pp. 47). Their father often gave them access to education, which enabled them to climb the social ladder. On top of that, the mixed community were given privileges that were not given to the black community. This meant that the mixed community got access to public office and administrative positions (5, pp. 26 & 42). This relatively privileged position of the mixed community in the Surinamese capital is visible in the Ward Register and reinforced by the fact that they owned enslaved people in large numbers compared to the black community.
Another factor that stands out in the spatial and temporal distribution of enslaved people is that the amount of enslaved people decreased during the researched period for the black community. If we once again compare 1838 and 1846, the amount of enslaved people owned by black enslavers decreased from 621 to 287, which is a decline of 53,78%. However this is not the case for the mixed community, who went from 2315 to 2254 enslaved people in the same period (2,63%). This slight decrease was also visible for white enslavers who lost 13,86% of their enslaved people between 1838 and 1846. Why is there such as a stark difference between the black and mixed communities? First of all, the black community lacked social mobility, meaning they were likely unable to purchase enslaved individuals. Another hypothesis can be that the phenomenon of chain manumission was practiced more within black communities, but we are not able to answer this question fully.
VI. Conclusion and Outlook on Future Research
In conclusion, the free non-white community of Paramaribo – an overlooked group in the historiography – was heavily involved in slave ownership. Especially the mixed community, through privileges that weren’t granted to the black community, showed significant social mobility by owning slaves. The biggest group of enslavers Paramaribo were of mixed descent, although, if corrected for population size, the white community is the most overrepresented group. Paramaribo was a racially concentrated city, with many of the white enslavers registered in the northeast (District A) and a large group of non-white enslavers in the southwest (District E and F). Over the time period of 1837-1846 we can see a decrease in enslaver and enslaved. We have speculated that the nature of owning enslaved people might be different for mixed and black populations, as practices like chain manumission and piki-nyan tend to be more common for non-white enslavers. Yet, the exact differences in practices of enslavement need more qualitative research. We would further urge researchers to analyse the differences between the ethnic groups, while also scrutinizing the borders between white, mixed and black personhood.
VII. Bibliography
A. Sources
- Hiemcke, A.G., ‘Plan van de stad Paramaribo, met aanwijzing der Nieuwe Wijk verdeeling’ (1850).
- Sang-Ajang, J., N. Altink, P. Dikland, C. Jonkers, Kariomengolo, C. Valies and T. van Oort, Paramaribo ward registers 1828-1847 (2024), https://hdl.handle.net/10622/ VLN8FD, IISH Data Collection
B. Literature
- De Bruijne, A. and A. Schalkwijk, ‘The position and residential patterns of ethnic groups in Paramariboʼs development in the twentieth century’, New West Indian Guide / Nieuwe West-Indische Gids 79:3/4 (2005) 239-271.
- Fatah-Black, K., Eigendomsstrijd. De geschiedenis van slavernij en emancipatie in Suriname (Amsterdam 2018).
- Neslo, E., Een ongekende elite. De opkomst van een gekleurde elite in koloniaal Suriname 1800-1863 (Dissertation Universiteit Utrecht 2016)
- Van Oort, T., ‘The Paramaribo Ward Register Database; A Fine-grained View of an Urban Slave Society (1828-1847)’, TSEG 22:3 (2025) 97-122.
- Van Stipriaan, A., Surinaams Contrast. Roofbouw en overleven in een Caraïbische plantagekolonie 1750-1863 (Leiden 1993).
