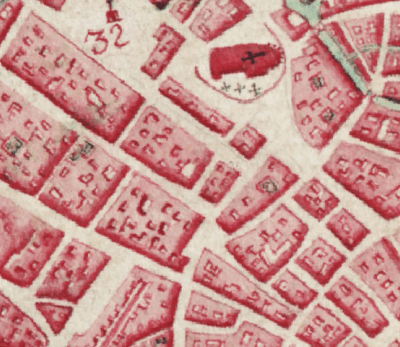
The Ghent Gazetteer is an ongoing project to create an urban gazetteer for the historical city of Ghent. The ambition is to create a linked open database of historical places for Ghent, similar to projects such as Adamlink and Gouda Tijdmachine. The underlying data are provided as csv files via: https://github.com/VincentDucatteeuw/Ghent-Gazetteer
Tijdelijke dataset waarmee locatiepunten uit het HISGIS project gekoppeld worden aan WGS84 coordinaten zodat Amsterdamse adressen op de kaart geplaatst kunnen worden.
Slave trade has so far mainly focused on the Atlantic trade. For Asian trade voyages have been studied by looking at a journey as a place of departure and a final place of arrival. However, vessels made several stops creating 'subvoyages'. We use Linked Data to visualize and analyse the relations between voyages and subvoyages.
The raw sample data and conversion scripts are available here.

Update 2022-01-30. We stopped the service on this data. You can still download the graph data (go to Graphs in the left panel). For new release of Amsterdam Historical GIS data, please visit the Adamlink website or Adamnet.
Like any other city, the city of Amsterdam has had many address changes in the past. A particular building, might have been split into two apartments, a block of houses taken down and build anew, streets names changes, to honour a new local here. This makes it very hard to pinpoint an exact geo-location, for an address registered at a historical document.
This dataset provides a mapping for all addresses in the centre of Amsterdam for the period 1860-1909. This includes changes in streetnames, house numbers and house numbers additions (e.g. '217d'). With this dataset it is not only possible to pinpoint addresses correctly over time, but to also study within city-migration patterns accurately.
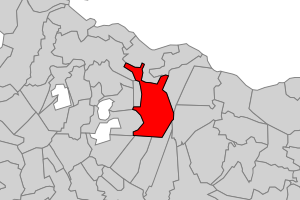
Nederland telt bijna 400 gemeenten. In 1812 waren dat er meer dan 1100. In twee eeuwen vol herindelingen, annexaties en fusies heeft Nederland bijna 1700 gemeenten gekend. De data van gemeentegeschiedenis is gebouwd op twee datasets: het Repertorium van Nederlandse gemeenten vanaf 1812 van Ad van der Meer en Onno Boonstra en de bij DANS gedeponeerde NLGis shapefiles van Onno Boonstra, waarin van elk jaar van 1812 tot 1997 de gemeentegrenzen zijn vastgelegd.
Dataset containing tables from Boudien de Vries' Electoraat en Elite (1986)
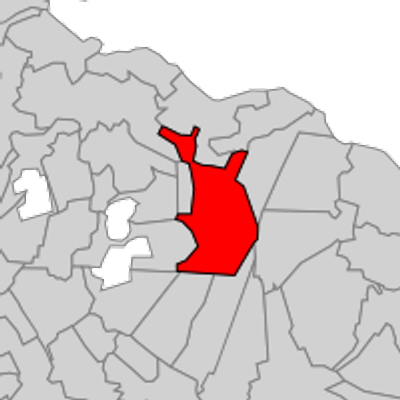
@en (Nederlands hieronder) Today, The Netherlands consists of nearly 400 municipalities. Back in 1812, there were more than 1100 municipalities. This datasets describes the history of municipalities from 1812 to present day. This dataset is a must-have when analysing or visualising Dutch municipality time-series data, or when studying individual level data in municipality contexts. This dataset consists of the 'Repertorium van Nederlandse gemeenten vanaf 1812' by Ad van der Meer en Onno Boonstra and NLGis shapefiles of Onno Boonstra available via DANS, for which the municipality borders were registered from 1812 to 1997. For the contemporary period (1997-today) the IISH and Webmapper have provided the missing information and provide yearly updates for, amongst others, the Dutch Electoral Council (Kiesraad).
Website: http://www.gemeentegeschiedenis.nl/
@nl Nederland telt bijna 400 gemeenten. In 1812 waren dat er meer dan 1100. In twee eeuwen vol herindelingen, annexaties en fusies heeft Nederland bijna 1700 gemeenten gekend. De data van gemeentegeschiedenis is gebouwd op twee datasets: het Repertorium van Nederlandse gemeenten vanaf 1812 van Ad van der Meer en Onno Boonstra en de bij DANS gedeponeerde NLGis shapefiles van Onno Boonstra, waarin van elk jaar van 1812 tot 1997 de gemeentegrenzen zijn vastgelegd.
Website: http://www.gemeentegeschiedenis.nl/
CShapes is a new dataset that provides historical maps of state boundaries and capitals in the post-World War II period. The dataset is coded according to both the Correlates of War and the Gleditsch and Ward (1999) state lists, and is therefore compatible with a great number of existing databases in the discipline. Provided in a geographic data format, CShapes can be used directly with standard GIS software, allowing a wide range of spatial computations. In addition, we supply a CShapes package for the R statistical toolkit. This package enables researchers without GIS skills to perform various useful operations on the GIS maps.
Homepage: https://icr.ethz.ch/data/cshapes/
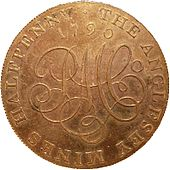
Polygons of the major coin issueing authorities that existed in the Low Countries between the 6th and the 21st centuries. This dataset also includes points for the mint houses responsible for the production of coins.